ErgMonkey
Third Party Integrations
Pricing
Description
Get more from your workout data
Import your Logbook/RP3 data to get better insights of your training and performance
Compare Workouts
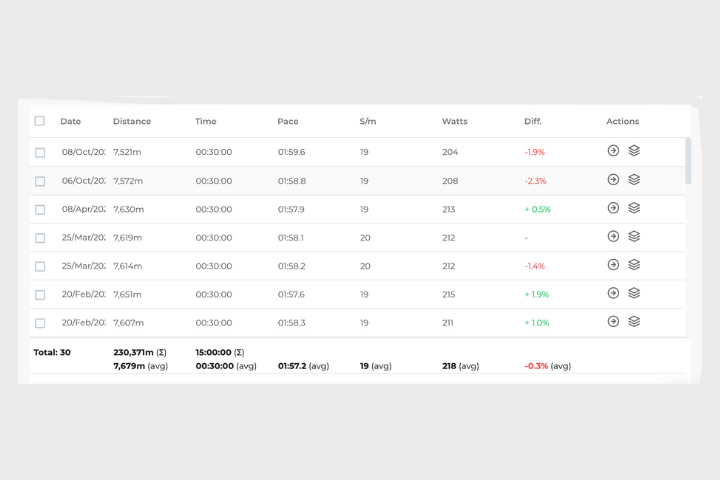
Compare the pace, stroke rate and heart rate for any same workout. E.g. Put all your 2k’s together and see how you paced them on one graph.
Heart Rate Zones
Set Heart Rate Zones and see each workout’s HR distrubution. Along with our Report that will show you your distribution for all workouts.
Interactive Graphs & Charts
We’ve summaries all your stats into a number of different graphs. Like our calendar heat map or our lockdown meters graph.
Review Your Progress
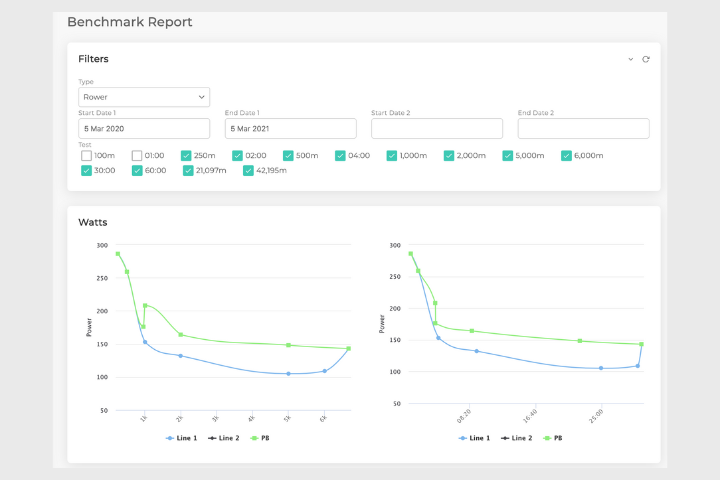
Our unique progress report will show you if you’re making progress or not, by taking all your training and comparing actual results.
Measure Improvement
Love a specific workout that you do it so often that its easy to compare? We’ve made it simple to see results for a specific workout to see % improvement.
Spot Trends
Wondered at what stroke rate you perform best? Our trend graphs and report will highlight your performances over time.
Report abuse
Report abuse
Other listings
Rowing List Newsletter
Join the Rowing List newsletter and receive offers, news, updates and more from great rowing products.


